728x90
300x250
SMALL
Chart.js | Open source HTML5 Charts for your website
New in 2.0 New chart axis types Plot complex, sparse datasets on date time, logarithmic or even entirely custom scales with ease.
www.chartjs.org
html에 위치를 잡아주고
 <div class="chart-wrap">
    <canvas id=test-chart2></canvas>
</div>
기본차트를 만들기 위해서는 type, data, options 이 세가지가 필요합니다.
const ctx = document.getElementById('myChart');
const myChart = new Chart(ctx, {
    type: 'bar',
    data: data,
    options:options
    });
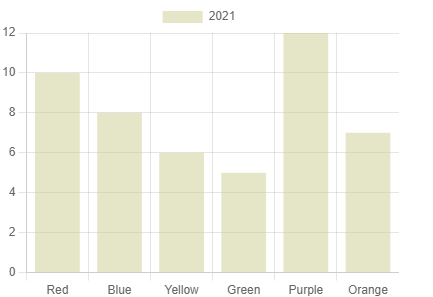
type : 'bar'로 변경해주면 막대 그래프로 만들어 집니다.
const ctx2 = $('#test-chart2');
        const myChart2 = new Chart(ctx2, {
        type:'bar',
        data:{
            labels:['Red', 'Blue', 'Yellow', 'Green', 'Purple', 'Orange'],
            datasets:[
                {
                    label:'2021',
                    data:[10,8,6,5,12,7],
                    backgroundColor:'rgba(203,206,145,.5)', //배경색상
                }

            ]
        },
        options:{
                    maintainAspectRatio :false//그래프의 비율 유지
                }
        });
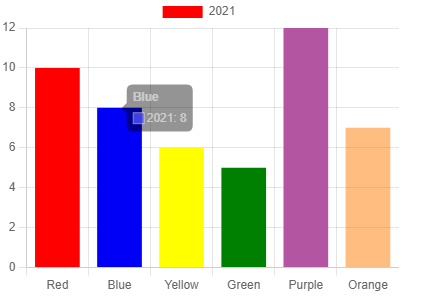
이번에는 만들어진 막대그래프의 색상을 각각 변경해 보겠습니다.
backgroundColor에 각각의 색상을 넣어주기만 하면 됩니다.
 const ctx2 = $('#test-chart2');
        const myChart2 = new Chart(ctx2, {
        type:'bar',
        data:{
            labels:['Red', 'Blue', 'Yellow', 'Green', 'Purple', 'Orange'],
            datasets:[
                {
                    label:'2021',
                    data:[10,8,6,5,12,7],
                    backgroundColor:[
                    "#ff0000",
                    "#0000ff",
                    "yellow",
                    "green",
                    "rgba(180,85,162,1)",
                    "rgba(255,127,0,0.5)"], //배경색상
                }

            ]
        },
        options:{
                    maintainAspectRatio :false//그래프의 비율 유지
                }
        });
728x90
반응형
LIST
'Front-end > chart.js & d3.js' 카테고리의 다른 글
| chart.js 수평막대그래프 만들기 (0) | 2022.01.29 |
|---|---|
| chart.js 라벨 숨기기 (최신버전) (0) | 2022.01.26 |
| chart.js 포인터 이미지로 변경하기 (0) | 2022.01.18 |
| chart.js 포인터 모양 변경하기 (0) | 2022.01.17 |
| chart.js 크기 고정 방법 (2) | 2022.01.15 |


댓글